--VOTER TURNOUT---[59%]
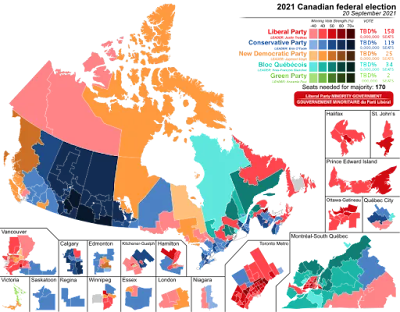
Conservative Party - 119 Seats / 34%
Liberal Party- 159 Seats / 32%---*
Liberal Party- 159 Seats / 32%---*
NDP - 25 Seats / 18%
Bloc Québécois - 33 Seats / 8%
Bloc Québécois - 33 Seats / 8%
PPC - 5%
Green Party - 2 Seats/ 2%
Green Party - 2 Seats/ 2%
Others - 1%
*This Ranking is based on Popular Vote--but the Liberal party won the most seats and will head the government
Western Prairies
Alberta- Conservative{57%/30 Seats} Liberal {15%/2 Seats} NDP {19%/2 Seats} Green {1%} PPC {7%} Maverick {1%}
Saskatchewan- Conservative {59%/14 Seats} NDP {21%} Liberal{11%} Green {1%} PPC {7%}Maverick {1%}
Manitoba- Conservative {39%/7 Seats} Liberal {28%/4 Seats} NDP {23%/43Seats} Green {2%} PPC {8%}
West Coast
British Columbia- Conservative {33%/13 Seats} Liberal {26%/15 Seats} NDP {29%/13 Seats} Green 5%/2 Seats} PPC {5%}
Central
Ontario- Liberal 39%/78 Seats} Conservative {35%/37 Seats} NDP {18%/5 Seats} Green{2%/1 Seat} PPC {5%}
Quebec- Liberal {34%/34 Seats} Bloc Québécois {33%/32 Seats} Conservative {18%/10 Seats} NDP {10%/1 Seat} Green {1%} PPC {3%} Free Party {1 %}
Maritime
Prince Edward Island- Liberal {46%/4 Seats} Conservative {32%} Green {9%} NDP {9%} PPC {3%)
Nova Scotia- Liberal {42%/8 Seats} Conservative {29%/3 Seats} NDP {22%} Green {2%} PPC {4%}
New Brunswick- Liberal {42%/6 Seats} Conservative {34%/4 Seats} NDP {12%} PPC {6%} Green {5%}
Newfoundland- Liberal {48%/6 Seats} Conservative {32%/1 Seat} NDP {17%} PPC {2%}
Territories
Yukon- Liberal {33%/1 Seat} Conservative {26%} NDP {22%} Green {5%}
North West Territories- Liberal {38%/1 Seat} Conservative {14%} NDP {32%} Green {2%}
Nunavut - NDP {48%/1 Seat} Liberal {36%} Conservative {16%}
--Ranked By Popular Vote--


